Selecting Worksheets and Charts |


|
Selecting Worksheets and Charts |
|
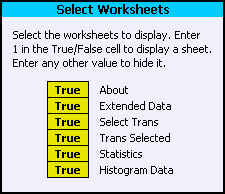
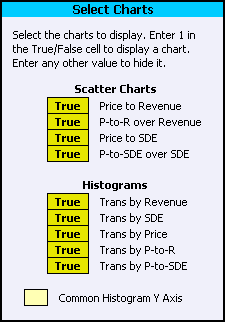
You can choose which worksheets and charts the workbook displays. You make your selections from the Select Worksheets and Select Charts sections of the Tools worksheet.
To select or deselect a sheet or chart using the mouse, right-click on its True/False cell. You can select a range of cells, then toggle all of them by right-clicking on the selected range.
To select a sheet or chart using the keyboard, enter the numeral one ("1") in its True/False cell. To deselect it, enter zero or press [Delete].
|
|
By default, the Y axes of the histogram charts are scaled automatically. Each chart will have the scale best suited to its own data. To make comparing the histograms to each other, you may want them to use a common Y axis scale. The workbook will apply a common Y axis scale when the Common Histogram Y Axis checkbox is filled. You can toggle the checkbox setting by right-clicking on it. To change the setting using the keyboard, enter "X" to fill the checkbox or press [Delete] to empty it.