![]()
BESWeb
Performing an Evaluation
|
Overview You perform an evaluation from the Evaluation Screen. To select the screen, click on its tab. Evaluation Tab
Just below the tabs is the toolbar, which is divided into two sections. The first section contains standard file commands. For help with these commands, see File Operations. Toolbar File Commands
The second section contains commands that you use in the evaluation process. Toolbar Evaluation Commands
This document assumes that you created an evaluation from the Quick Start Screen and are looking for help with the evaluation process. Using the Navigator
You turn display of the Navigator on and off by clicking on the Hide/Show Navigator button in the toolbar.
Report Text The first step in performing an evaluation is to complete the Report Text worksheet. As the name of the sheet implies, the data you enter in this sheet is used to customize the report for the current evaluation. Start by entering the date of the evaluation in mm/dd/yy format, then complete the sections for the Subject Business and the Evaluator. The Evaluator is the person who will sign the cover letter that accompanies the report. Questionnaire The second step in the evaluation process is to answer the questions in the Questionnaire worksheet. If you find the Questionnaire is too wide for your screen, trying hiding the Navigator (see above).
For help with specific questions, see Expanded Explanations for the Questionnaire. The third step in the evaluation process is to complete the Earnings worksheet. The form of the worksheet is determined by your response to the first question on the Questionnaire:
Estimate actual cash cost of operating this business by removing non-productive expenses and adding all non-cash expenses. Do not add back the interest expense incurred by "floor planning" or any promissory note that will be assumed directly or "wrapped". Deduct revenue that was generated by selling assets, unusual activities, or from sources other than this business. Current Earnings Enter the current earnings data, then click on the Calculate Now button in the toolbar. BESWeb will update the Discretionary Income calculated at the bottom of the schedule.
Normalized Earnings If you find the Normalized Earnings worksheet is too wide for your screen, trying hiding the Navigator. To normalize earnings, you enter data for the last three years, project results for the next three years, and weight the combined six years to calculate a weighted average Discretionary Income. Historic and Projected Earnings In the Historic and Projected Earnings section, complete these steps:
Weighting the Years In the Weighting section you enter a percentage weight for each of the historic and projected years. The default weight is the same for all six years: 16.7%, or one-sixth. To change the weights, overwrite the default values. Verifying the Results The Normalized Results section at the bottom of the worksheet displays the results of the normalization calculations. Review these results for plausibility. Industry Method Input A few industries require additional input for the Industry Method of evaluation. If you selected one of these industries for the second question on the Questionnaire, the Industry Method Input worksheet will request that input. Here are the industries that require additional input:
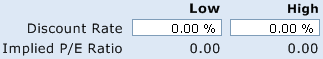
If you're not working with one of the industries, the Industry Method Input worksheet will tell you that no additional input is required. Discounted Cash Flow The Discounted Cash Flow worksheet is divided into four sections. Each section is explained separately below. Discount Rate
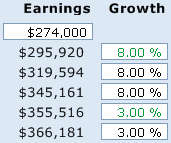
Projected Earnings By default earnings for the current year are set to Discretionary Income from the Earnings Worksheet. For the purposes of the Discounted Cash Flow method, you can overwrite this value by entering a new number in the Current Year Earnings input cell. Click on the Calculate Now button to apply your change to the worksheet.
For example, to apply an eight percent growth rate for the first three years, then three percent for the remaining years, enter "8" in the Projected Y1 Growth input cell and "3" in the Projected Y4 cell, then click on the Calculate Now button. BESWeb will turn the numbers in the two cells that you changed green, and leave the numbers in the input cells that still contain formulas black. This makes it easy to see which inputs you have changed and which are being calculated.
Terminal Value The terminal value is calculated automatically and does not require any inputs. Indicated Value To complete the Discounted Cash Flow method, enter a value for Net Excess and Non-Operating Assets in the only input cell in the Indicated Value section. Click on the Calculate Now button to update the calculations and see the final results. Market Approach The Market Approach worksheet is designed to accept market comparables input from two data sources: IBA Market Data and BIZCOMPS®. The worksheet is divided into three sections. Revenue Multiples For each data source (IBA and BIZCOMPS®), start by reviewing the Revenue amount and changing it if necessary. If you normalized earnings (see the first question on the Questionnaire), the default revenue value comes from the Normalized Results section of the Earnings worksheet. If you did not normalize earnings, the default value comes from question 14 on the Questionnaire. Enter the P/R Ratio derived from your analysis of comparable transactions from the data source. A discussion of that process is beyond the scope of this document. See any documentation available for the data sources.
Finally, assign a Weight to the Indicated Value calculated for the data source. Reasons for assigning a higher weight include more transactions from the data source that are comparable to the business you are evaluating, or the comparable transactions are for businesses that more closely resemble the subject business. Click on the Calculate Now button to update the Weighted Value line. Earnings Multiples For each data source, start by reviewing the Earnings amount and changing it if necessary. If you normalized earnings, the default earnings value comes from the Discretionary Income line in the Normalized Results section of the Earnings worksheet. If you did not normalize earnings, the default value comes from the Discretionary Income at the bottom of the Earnings worksheet. Both data sources report earnings differently than they are calculated in BESWeb. IBA Market Data reports Discretionary Earnings, which is defined as following: Annual earnings before owners' compensation expense, interest expense, and income tax expense. BIZCOMPS® reports Seller's Discretionary Earnings, defined as: Net profit before taxes and any compensation to owner, plus Amortization, Depreciation, Interest, Other Non-Cash Expense and Non-Business Related Expense. Normally to one working owner. Neither of these earnings definitions match the Discretionary Income calculation used in BESWeb. To see how Discretionary Income is calculated, review the Earnings worksheet. To correct for the difference, enter an amount in the Adjustments line. The amount you enter should compensate for the difference between the earnings definition used by the data source and the Discretionary Income figure calculated by BESWeb.
Next enter the P/E Ratio derived from your analysis of comparable transactions from the data source. A discussion of that process is beyond the scope of this document. See any documentation available for the data sources. Click on the Calculate Now button to apply the P/E ratios. Finally, assign a Weight to the Indicated Value calculated for the data source. Reasons for assigning a higher weight include more transactions from the data source that are comparable to the business you are evaluating, or the comparable transactions are for businesses that more closely resemble the subject business. Click on the Calculate Now button to update the Weighted Value line. Comparative Company Value BESWeb calculates a range of values by applying a percentage spread to the Total Weighted Value. The default spread is 7%, meaning that the High Value is set 7% above the Total Weighted Value and the Low Value is set 7% below. To change the spread, enter a new value in the Plus/Minus Range input cell, then click on the Calculate Now button. Conclusions The Conclusions worksheet weights the evaluation methods to arrive at a Suggested Price and the estimates of asset, intangible, and market value. By the default the same weight is applied to all of the methods that produce a value range. If a method does not produce a value range (low and high values are both zero), the method is omitted from the calculations.
Justification Assumptions The Justification Assumptions worksheet sets the financing terms for an acquisition of the business and the parameters for the post-sale cash flow. Financing
Post-Sale Cash Flow The inputs in the Post-Sale Cash Flow section set the parameters for projected cash flow following the sale.
Post-Sale Cash Flow The Post-Sale Cash Flow worksheet calculates the projected cash flow following the sale. There are no inputs on this worksheet. All of the inputs for the calculations are on the Justification Assumptions sheet. Sanity Check The Post-Sale Cash Flow worksheet reports on the projected financial results of the acquisition. There are no inputs on this worksheet. All of the inputs for the calculations are on the Justification Assumptions sheet. Downloading the Workbook
|
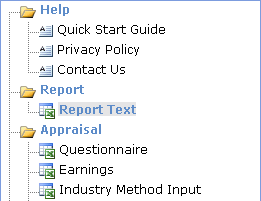 The Navigator appears below the toolbar on the left side of the Evaluation Screen. You use it select the help topics, worksheets, and charts that you use in the evaluation process. For example, to display the Report Text worksheet, you click on it in the Navigator.