Overview
The Transaction Analysis export option for the KeyValueData BIZCOMPS® database downloads transaction data in a Microsoft® Excel workbook that contains analysis worksheets and charts. This document explains how to use the analysis workbook. It contains the following sections:
![]() Selecting Transactions for Analysis
Selecting Transactions for Analysis
![]() Selecting Transactions Manually
Selecting Transactions Manually
![]() Selecting Transactions Automatically
Selecting Transactions Automatically
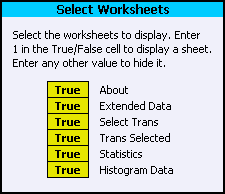
![]() Selecting Worksheets and Charts
Selecting Worksheets and Charts
![]() Exporting the Selected Transactions
Exporting the Selected Transactions
About the Data
The BIZCOMPS® User Guide explains the data. To see the User Guide, click here.
Click here to read the BIZCOMPS® data field definitions.
 |
The Transaction Analysis Workbook uses Excel macros. You must enable the macros to use the workbook. See Enabling Macros in Microsoft® Office. |
There are seven worksheets and nine charts in the analysis workbook.
About
The About worksheet contains two hyperlinks, one to help on enabling the macros used in the workbook, and one to this help file. It also summarizes the other worksheets and charts.
Extended Data
The Extended Data worksheet contains all of the data available for the downloaded transactions. A subset of this data is used in the analysis performed in the workbook. The data used in the analysis is drawn from the Trans Selected worksheet.
Select Trans
The Select Trans worksheet shows the selection status for all of the downloaded transactions. You can manually select the transactions to analyze.
|
When you first open a workbook, some of the transactions are selected and some are not. The selected transactions are the ones that contain data for both valuation ratios. See Ratio Validation for more information. |
When you first open a workbook, the Select Trans worksheet displays a comment explaining how to select transactions. To hide this comment, right-click on the Selected column header and choose Hide Comment from the Excel pop-up menu.
Hiding the Comment
![]()
Trans Selected
The Trans Selected worksheet contains the selected transactions. The data used in the analysis comes from this worksheet. The Trans Selected worksheet is updated automatically every time you change the transactions that are selected in the Select Trans sheet. You can deselect transactions from this worksheet. Like the Select Trans worksheet, the Trans Selected worksheet has a comment attached to the Selected column header that you need to hide before you use the worksheet.
Tools
The Tools worksheet automates analysis tasks. You can select transactions by search criteria (such as revenue or SDE), sort the transactions in all of the worksheets at once, export the selected transactions to a new workbook, and more. For help, see the following sections:
![]() Selecting Transactions Automatically
Selecting Transactions Automatically
![]() Selecting Worksheets and Charts
Selecting Worksheets and Charts
![]() Exporting the Selected Transactions
Exporting the Selected Transactions
Statistics
The Statistics worksheet provides two groups of statistics, one for all of the downloaded transactions, and one for the selected transactions.
Histogram Data
The Histogram Data worksheet contains the data used in the histogram charts.
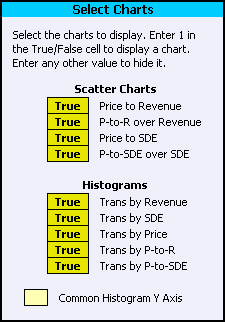
Scatter Charts
A scatter chart shows the relationship between two variables, with each selected transaction appearing as a point showing the transaction's values for the two variables. There are four scatter charts in the workbook:
![]() Price to Revenue
Price to Revenue
![]() P-to-R over Revenue (Price-to-Revenue over Revenue)
P-to-R over Revenue (Price-to-Revenue over Revenue)
![]() Price to SDE
Price to SDE
![]() P-to-SDE over SDE (Price-to-SDE)
P-to-SDE over SDE (Price-to-SDE)
A histogram shows how the selected transactions are distributed across the range of a given variable. For example, the Trans by Revenue histogram shows how many transactions fall into each percentile of the revenue range, with the minimum revenue at the first percentile (1%) and the maximum revenue at the one hundredth percentile (100%). There are five histograms in the workbook:
![]() Trans by Revenue (Transactions by Revenue)
Trans by Revenue (Transactions by Revenue)
![]() Trans by SDE (Transactions by SDE)
Trans by SDE (Transactions by SDE)
![]() Trans by Price (Transactions by Price)
Trans by Price (Transactions by Price)
![]() Trans by P-to-R (Transactions by Price-to-Revenue)
Trans by P-to-R (Transactions by Price-to-Revenue)
![]() Trans by P-to-SDE (Transactions by Price-to-SDE)
Trans by P-to-SDE (Transactions by Price-to-SDE)
Y Axis Scale
The histograms can share a common Y axis scale, or can be scaled independently. See Common Histogram Y Axis.
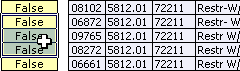
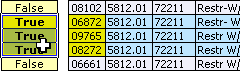
Selecting Transactions for Analysis
A transaction is selected for analysis when it displays True in the Selected column of the Select Trans worksheet. The following image shows two transactions, one that is selected for analysis and one that is not:
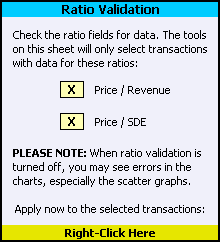 Ratio Validation
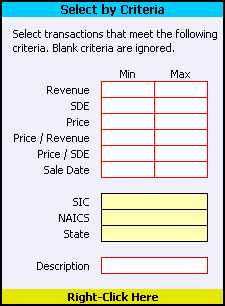 Selecting Transactions by Criteria
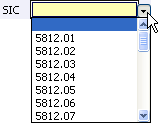 The
The 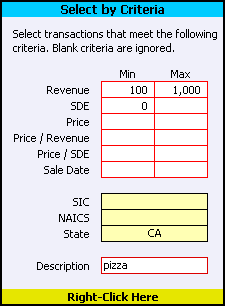 Description