Chart Commands
A Chart command is hot-linked to a chart. When updated, it inserts a picture of the chart into the command. You change the settings for a Chart command from the Edit Command Panel in the Report Navigator.
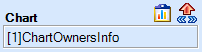
The Chart text displays the location of the linked chart. The number in brackets is the file ID. The rest of the text string is the chart's name. To view the linked chart, click on the Go to Chart Button. To change the linked chart:
Select the chart that you want to link to.
Click on the Copy Link Button in the Desktop Toolbar. You can also select Edit | Copy Link.
Go to to Report Mode and click on the Paste Chart Button in the top right corner of the Edit Command Panel.
Click on the Apply button in the lower right corner of the Edit Command Panel. The new chart will be applied to the command. |
The Color control sets the color format of the chart image.
|
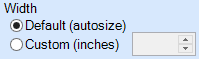
You can let the software set the width of the chart's image, or you can set the width manually. Default (autosize)The default width of the chart is the same as in the spreadsheet, unless the spreadsheet chart is wider than the page width in the report. In this case, the chart width becomes the page width. CustomThe Custom field sets the width of the chart in inches. Widths greater than the page width (up to 20") are allowed; in these cases, the displayed chart extends off the page and appears truncated. Regardless of how the width is set, the height of the chart is calculated to preserve the same aspect ratio as in the spreadsheet. |